

Overview
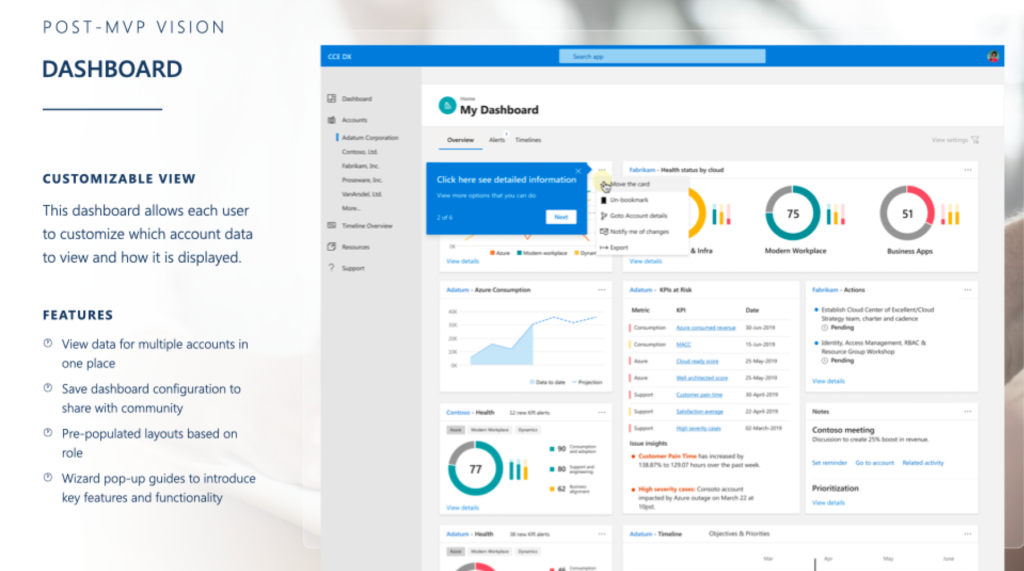
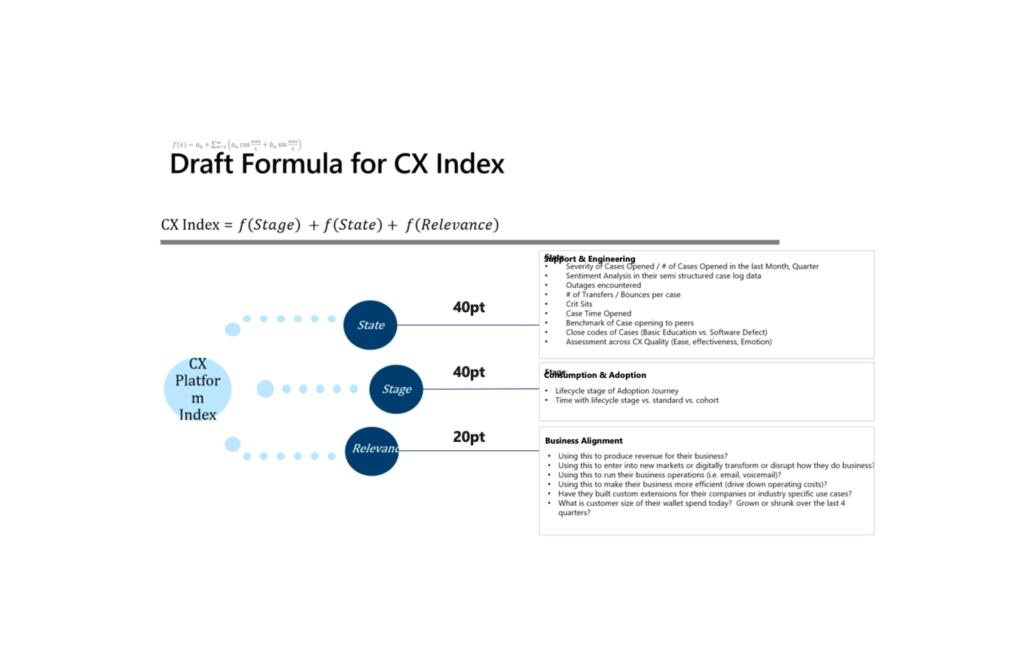
A transformative initiative at a leading technology company focused on consolidating numerous fragmented tools into a unified solution to enhance the digital customer experience, along with developing a new system for assessing customer health.
Focus
- Design Operations (process definition, workshop facilitation, tool optimization)
- User Research & Feedback Loops
- Prototyping & Visual Design
- Cross-Functional Collaboration
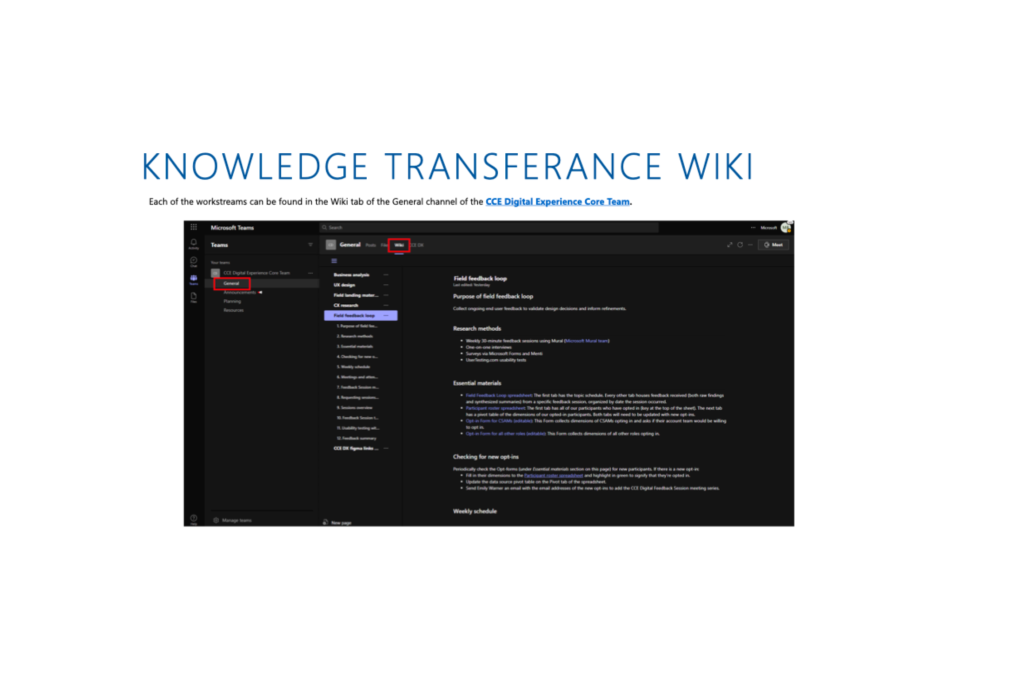
- Knowledge Management
- Advocacy for Design Needs
Purpose
To address inefficiencies from a “disconnected customer support system,” a unified interface was developed to enhance effectiveness and user satisfaction.
Team
- Role: UX Designer
- Responsibilities: Leading workshops to facilitate user insight synthesis; conducting user research and developing usability testing protocols; advocating for design needs and expanding the design system; managing team alignment and knowledge transfer amidst high turnover.
- Team: Multidisciplinary team involving consulting partners, program managers, developers, and researchers.
Scope
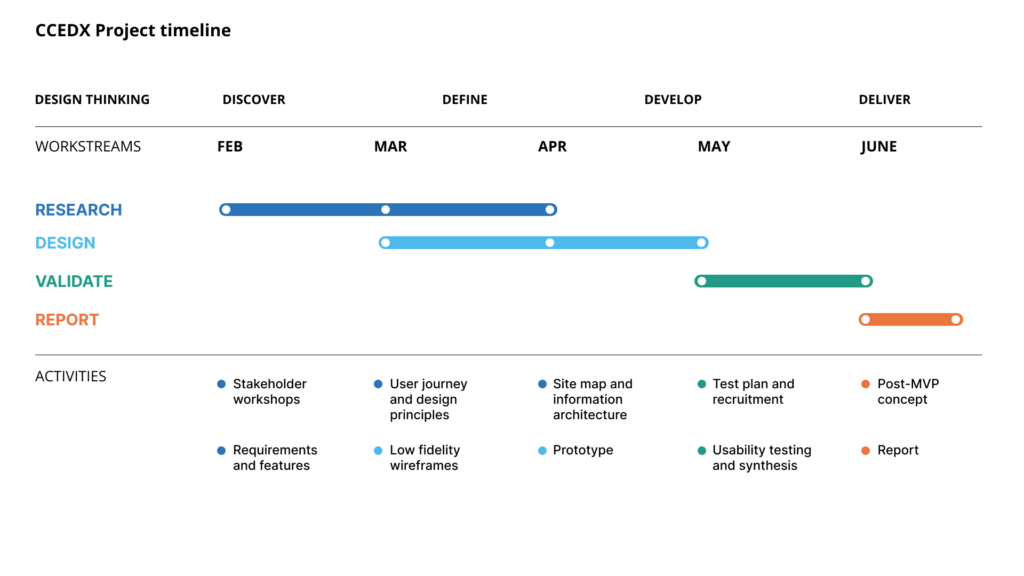
- Timeline: 5 months
- Scope: Delivery of MVP designs for essential components, alongside a comprehensive design system.
- Constraints: Addressing team turnover, shifting priorities, and aligning cross-team efforts under tight timelines.
Process
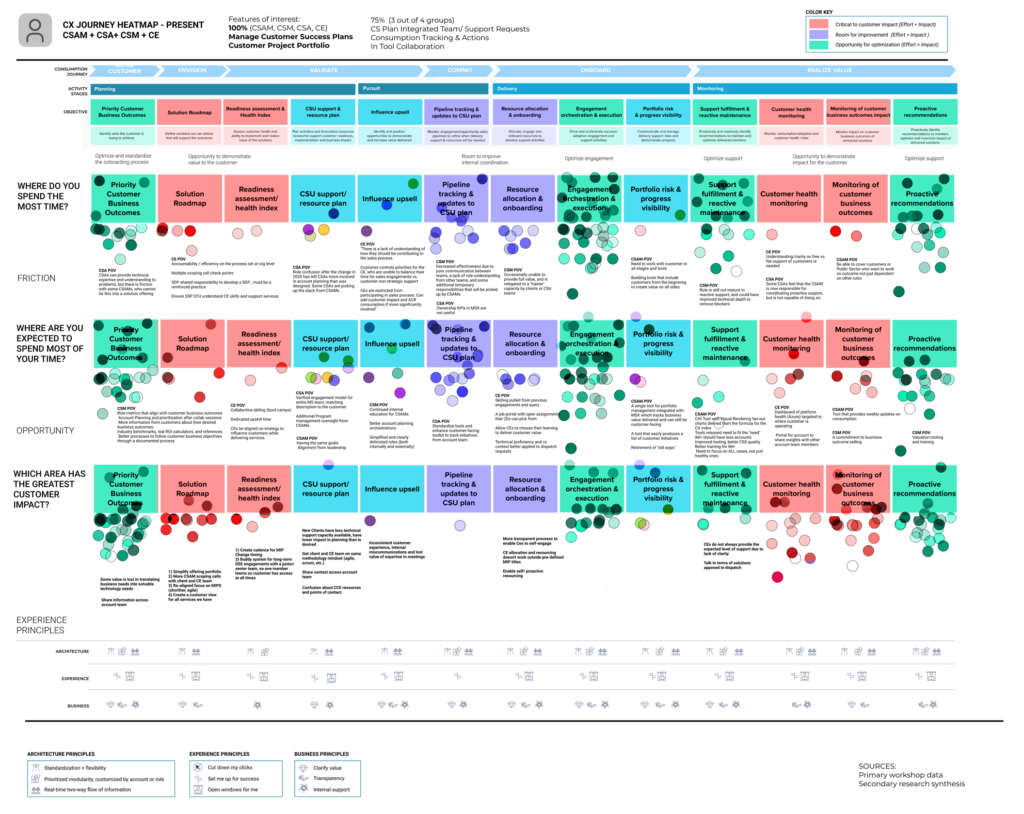
- Research & Discovery: Led workshops for user insights, creating journey maps, and identifying pain points; conducted in-depth user research to guide design decisions.
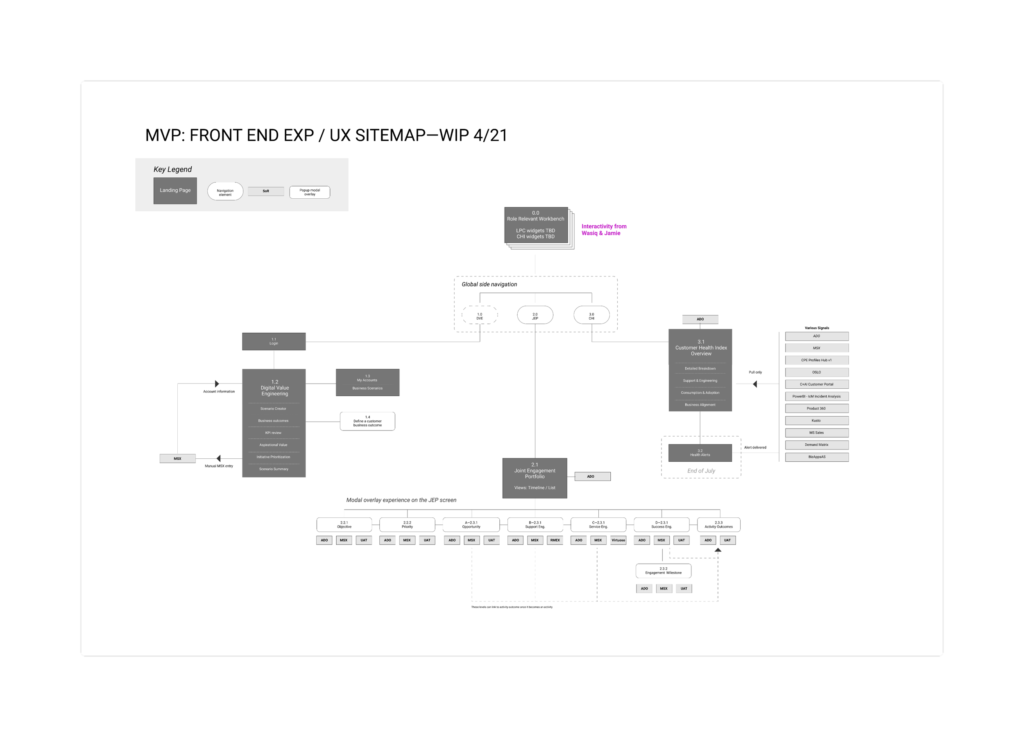
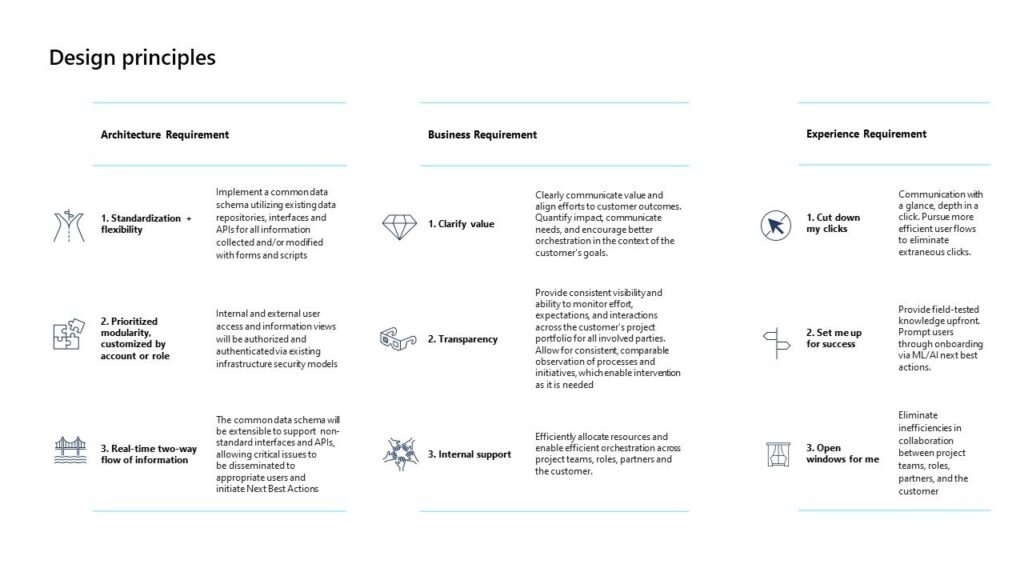
- Product Strategy & Ideation: Defined core experience principles and designed scalable information architecture; developed prototypes emphasizing modularity and clarity.
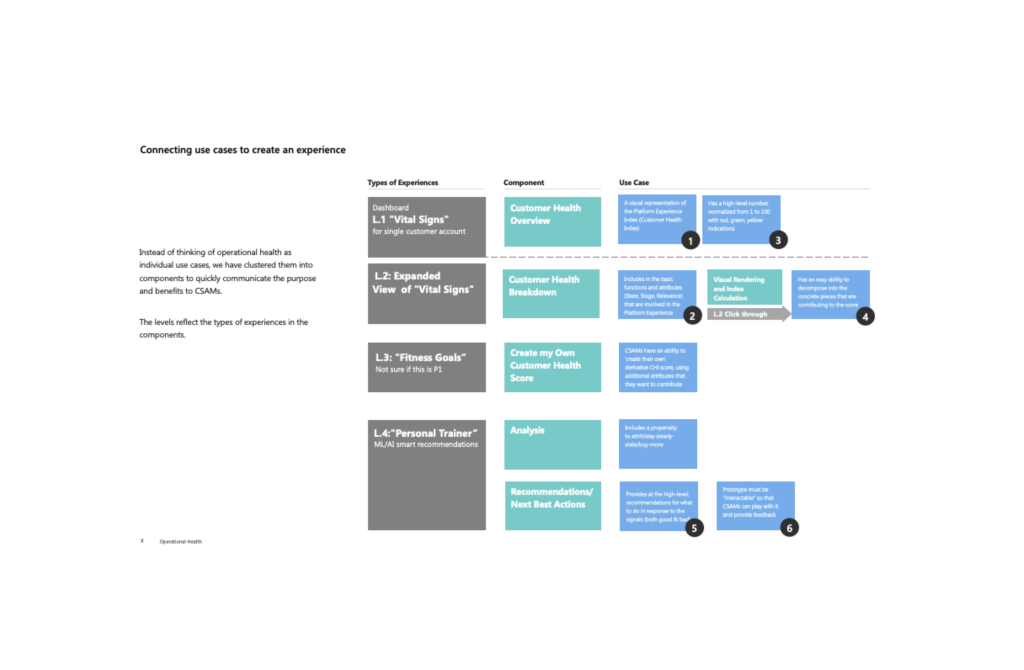
- Experience Design & Prototyping: Created wireframes and expanded the design system for new interactions; implemented visual systems to inform decision-making.
- Testing & Iteration: Conducted iterative usability testing with feedback from users to refine designs.
Results
- Outcomes & Results: Delivered MVP designs with strong effectiveness ratings and user engagement; validated features that drive user satisfaction.
- Lessons Learned: Emphasized the importance of clear role definitions, consistent collaboration, and proactive problem-solving in adapting to project changes.
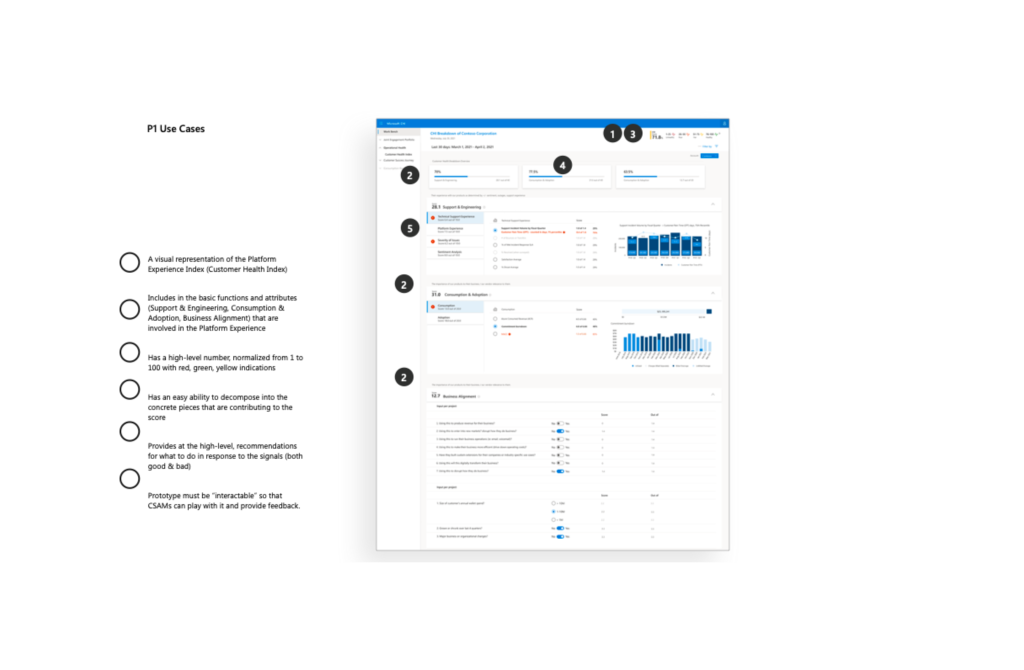
Resolution
Maintained project continuity through proactive knowledge transfer and collaboration, despite turnover challenges, leading to alignment and a successful prototype.
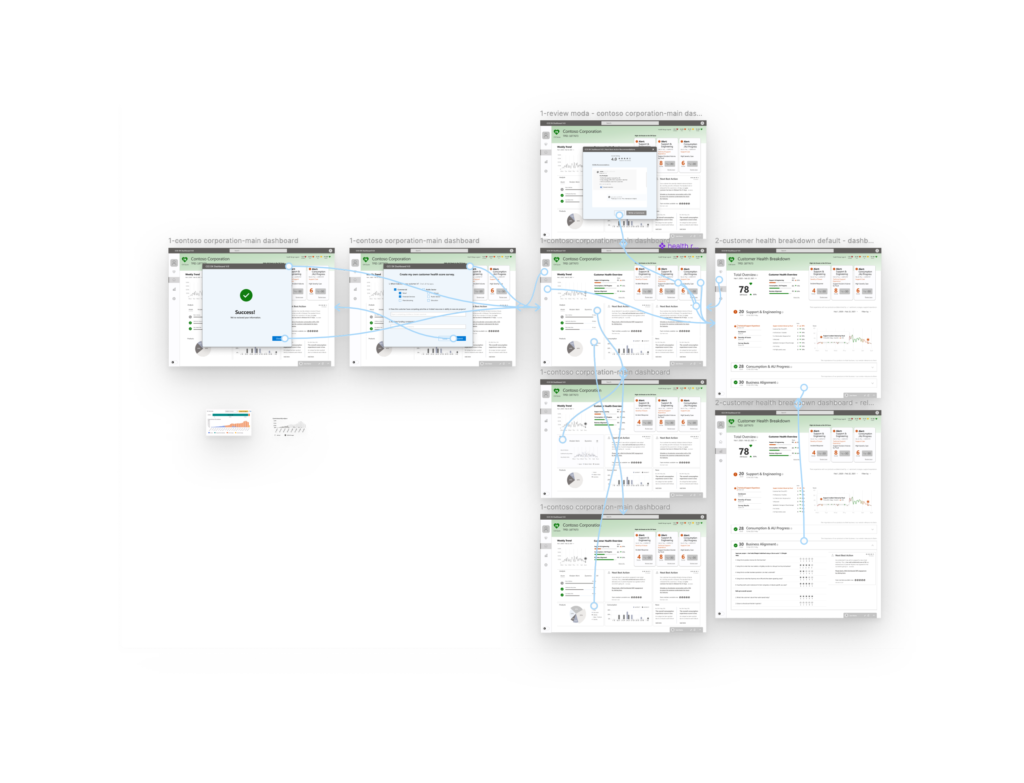
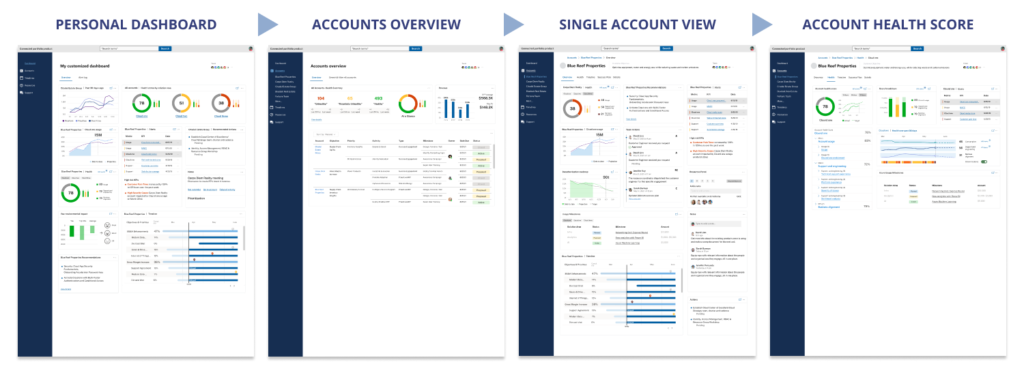
Conclusion
- Project demonstrates capacity to lead design operations, foster cross-functional collaboration, and deliver user-centered solutions.
- Highlights dedication to impactful digital experiences and ability to influence strategies through user-centered design.